Discover how Aidoc’s AI platform offers seamless end-to-end integration into a facility’s existing IT infrastructure enabling implementation of AI at scale.
Discover how Aidoc’s AI platform offers seamless end-to-end integration into a facility’s existing IT infrastructure enabling implementation of AI at scale.
If I had told you four months ago that the growing trend of increased demand for medical imaging would plummet due to a global pandemic – you may have called me crazy. Yet – we have found ourselves experiencing the unimaginable – with COVID-19 significantly impacting the nature of the radiology workflow, and beyond the world of radiology – unleashing an unprecedented wave of uncertainty in all aspects of life.
With COVID-19 taking up so much space in our global consciousness, I wanted to contribute to this conversation with clarity, transparency and like the AI nerd that I am, hard data. Our goal is to share the recent imaging trends identified by our analysis servers so we can have an open discussion on the current state of medical imaging in relation to COVID-19 and discuss and predict what we can expect as we move forward.
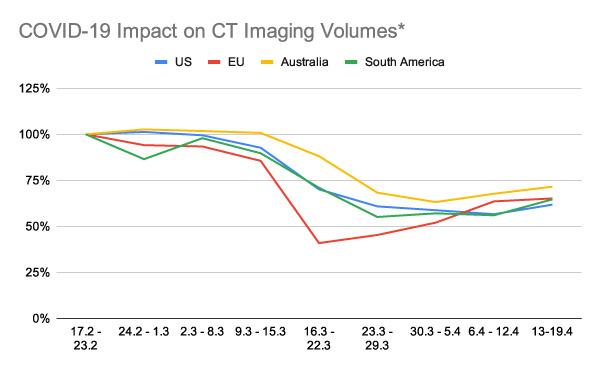
Below we’ve broken down CT imaging volumes from a subset of pathologies and sites we support including the United States, Europe, South America and Australia. These graphs are dynamic and will be updated weekly. We’ll be sharing further conclusions as more data comes in so be sure to check back for further insights.
*Data set based on 70,000 scans Baseline as of February 10th
Our most recent observations as of April 19th
As we round out two months of reporting on the COVID-19 impact on CT imaging volumes, we are now seeing all regions following similar upwards trajectories. This week we see that the U.S is finally on an upward trend in CT imaging volumes with an increase of 5% this last week. Finally!
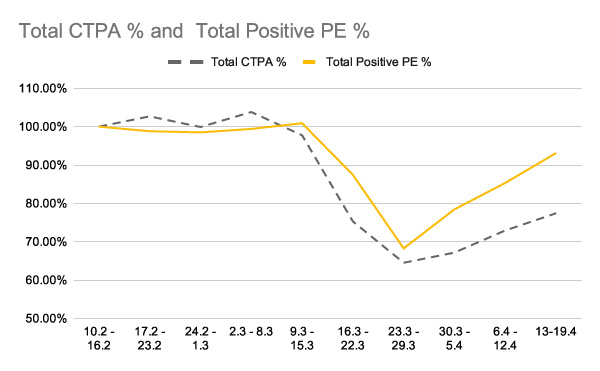
Our pathology specific trends continue to support the observations relating positive PE to COVID-19. The gap in decline between CTPA volumes and positive PE volumes continues to grow with CTPA volumes at 77.4% of baseline vs positive PE at 93.1% of baseline – an 8% increase from the previous week.
We will continue to monitor these trends and update you as additional insights are brought to light.
Our observations as of April 12th
We’re officially two months out since the start of our COVID-19 data analysis and are seeing that the decline in imaging volumes may be starting to stabilize.
European CT imaging numbers are now entering the second week of increase in scan volumeshowing another 12% increase from the previous week. The US is showing signs of stabilizing the decline with only a 2% reduction in volumes last week (April 6th – April 12) versus a 4% reduction from the previous week (March 30 – April 5th). Similar to Europe, Australia is also showing week on week recovery in scan volumes and are now at 69% of total scan volume compared to the baseline.
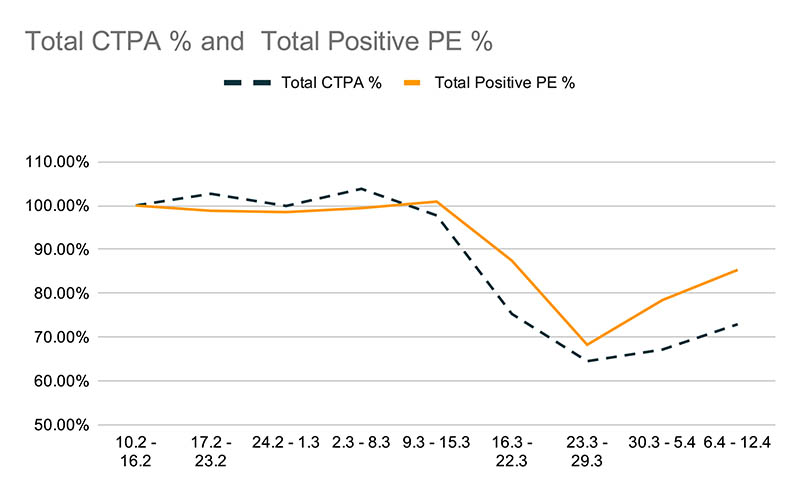
We also continued to track the impact on specific pathologies. When looking at scan volumes for both CTPA and positive PE cases flagged by our solution we see that the decline in CTPA volume is substantially sharper than the decline in positive PE cases. As a subset of the volumes noted above, we can note a slight increase in volumes during the last week with current volumes compared to the pre-COVID baseline at 72.9% for total CTPA and 85.3% for positive PE.
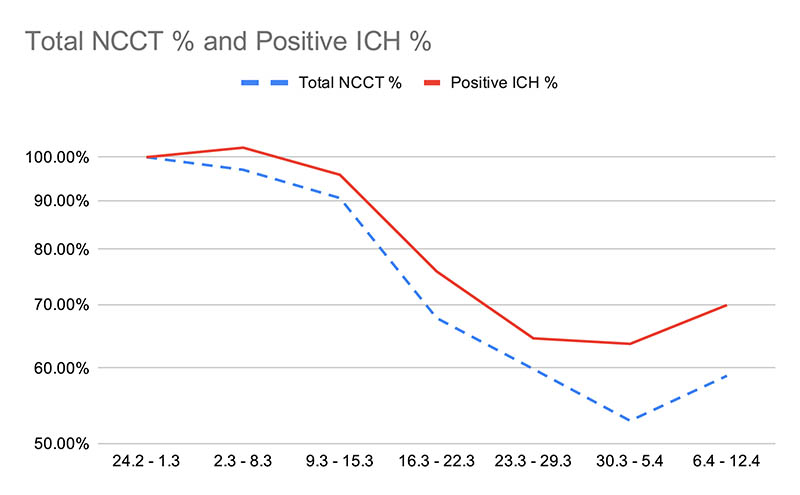
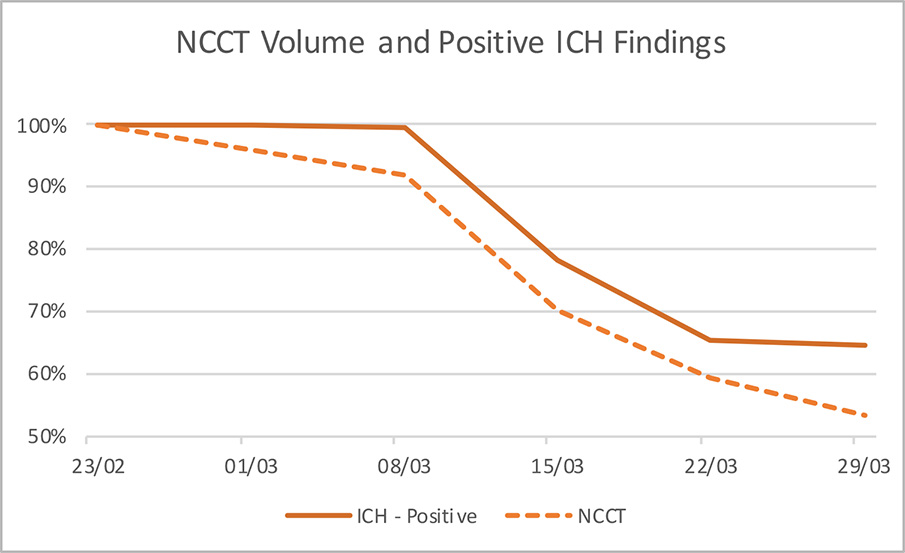
When looking at scan volumes for NCCT and positive ICH cases flagged by our solution we see that current volumes compared to the pre-COVID baseline at 59% for total NCCT and 70% for positive ICH.
Could the fact that positive ICH volumes decreased much more than positive PE volumes further support the observation related to COVID-19 being a pro-coagulant pathogen?
Our observations as of April 7th
For the first time since the beginning of February, volumes are increasing in some regions(!).
European CT imaging numbers have stopped their decline, and have shown an increase in scan volume of 9% versus the previous week yet still showing an overall decline of 46% from the pre-COVID baseline.
Following suit, we see that imaging volumes may be starting to stabilize in the US as well with only a 4% reduction in the last week (April 1st – April 5th) versus a 14% reduction from the previous week. (March 23rd – April 1st).
This week we delved deeper into understanding the impact on positive imaging. We compared the reduction in overall head CT volumes, with the volume of positive ICH exams.
Compared to the pre-COVID baseline, we saw a 35.5% reduction in flagged positive ICH cases. While total head CT volumes decreased by 46.7%.
Causes of this phenomena can be speculated widely. There could be many explanations for this reduction – less trauma as patients are staying home, less follow up imaging for ICH patients, and many more. We leave that exploration up to you.
Our observations as of April 1st
We persist in our review of the subset of pathologies and sites we support and see a continued trend of decline in overall CT volume since the beginning of February (39%) worldwide.
That being said, we see imaging volumes are starting to stabilize, especially in the EU and the US. In the EU, we see only a 4% reduction in the last week (March 23rd – April 1st) versus a 39% reduction from the previous week (March 16th – March 22nd). In the US we see a 14% reduction in the last week (March 23rd – April 1st) versus a 20% reduction from the previous week. (March 16th – March 22nd)
Australia and South America are now experiencing significant decreases in overall volume with 32% and 46% decreases from the baseline respectively. The main drop in volumes could be seen last week (22% and 23%) respectively as they’re ramping up efforts to mitigate risk as COVID-19 begins spreading to these regions.
This week we further investigated these trends and looked at the volumes of CTPA scans as well as the number of positive PE cases that our solution detected.
When comparing data from the beginning of February to April 1st, we found a 25% decrease in CTPA volume. However, when we looked at our academic sites specifically, we saw an increase in the prevalence of positive PE cases from 11% at the beginning of February to 18% this week.
This correlates with anecdotal information we hear that mostly more critical patients are undergoing CT exams than in the usual course of business.
Is your institution seeing similar trends of a reduction of potentially urgent pathologies?
Our observations as of March 22nd
The most notable impact is a 20% decrease in total CT volume during the past week vs the same week last month. The major decrease came from European sites (39%), with US sites (20%) dropping as well. I have heard people state that they expect the EU to be a prelude to what will happen in the US, in which case we are yet to see how other countries fare. I will provide more insights as this week progresses, but in the meantime, I would welcome your thoughts – Is your radiology department experiencing similar trends as to what we’re seeing? Please feel free to comment and contribute to this conversation. I truly believe that the more data we share with each other – the better chances we have of creating innovative solutions to address this challenge.